You have an important story to tell, with a compelling rationale to back up your story. However, telling that story can get a bit complicated. Data Visualization (graphically demonstrating your data or process) is one of the most engaging ways to tell your complicated story.
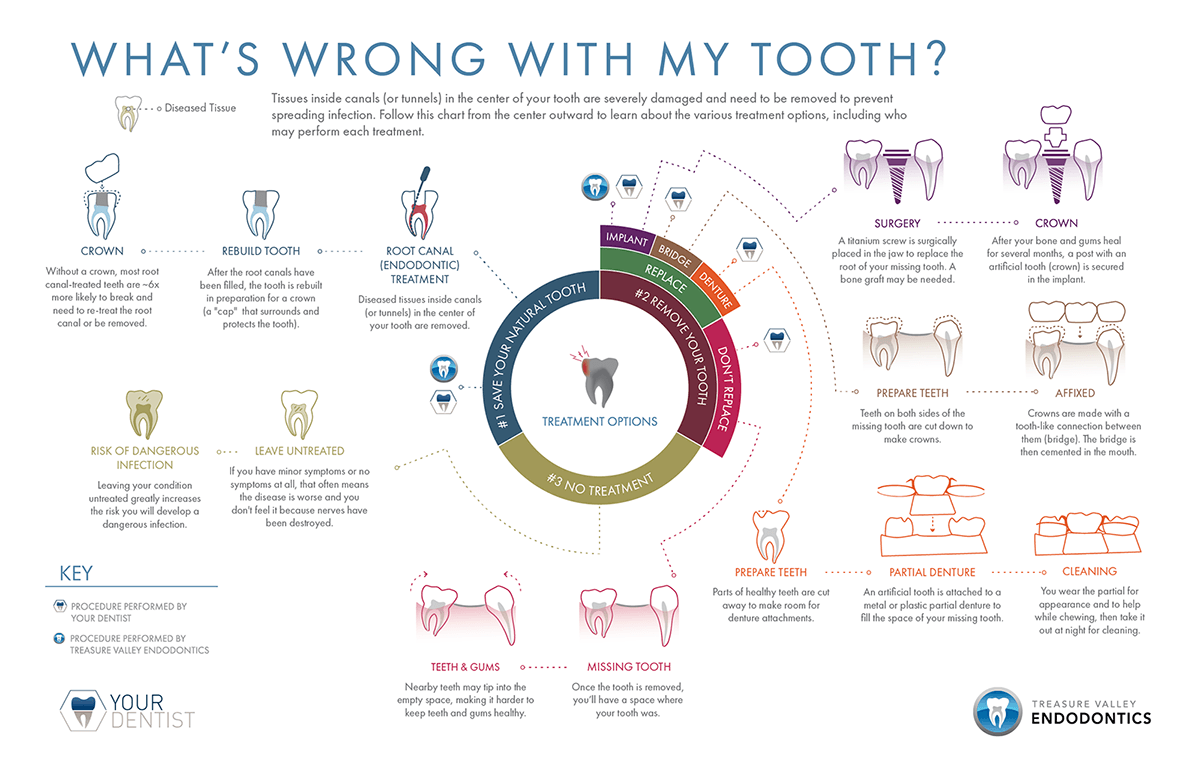
Treasure Valley Endodontics’ Tooth Treatment Options Infographic
With Serfwerks’ infographic development service, we help you map out your story and/or process and represent it visually in a way that not only captures the attention of your target audience, but do it in a way that entertains them. From the whimsical to the scientific, Serfwerks can help you develop out an infographic that brings new life and interest to your story.
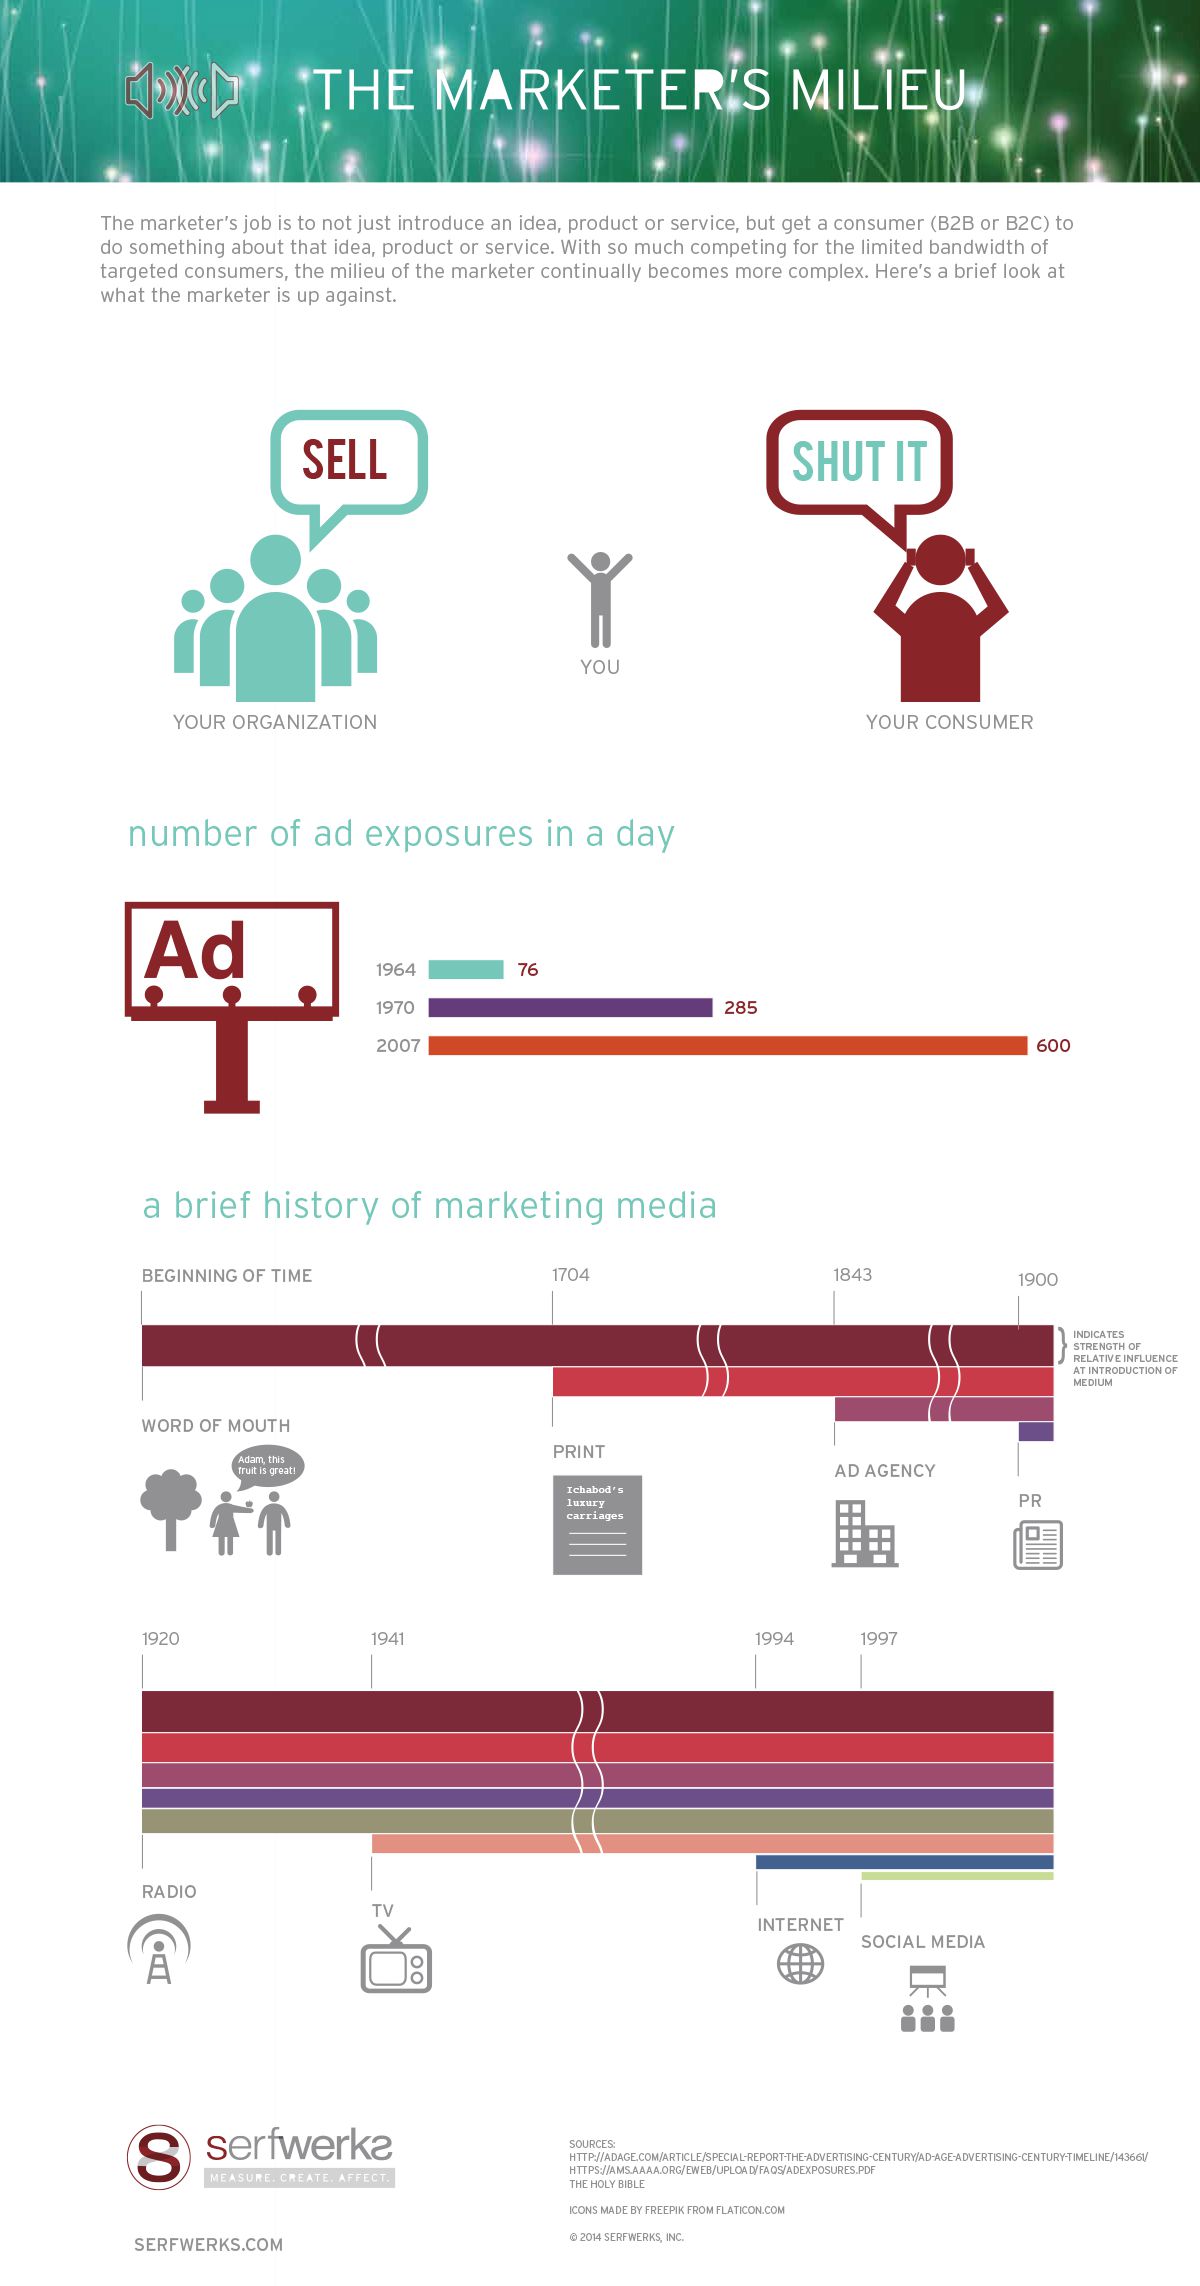
Marketer’s Milieu Infographic
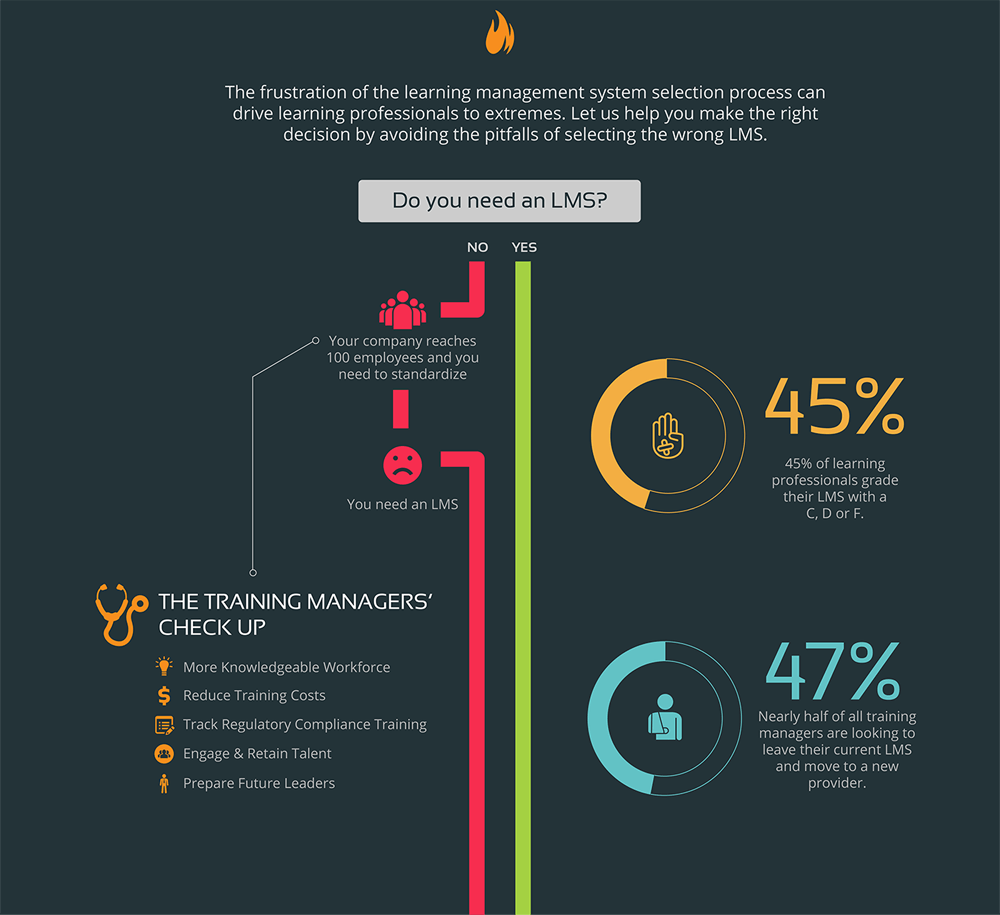
Torch LMS Purchase Process Infographic